When a student’s junior year of high school comes around, almost inevitably they start hearing the questions that they have dreaded most since the beginning of freshman year: “Do you know where you want to go to college?” “Do you know what you want to major in?”. As well-intentioned as those people may be, to the student it feels like the adults in their life are constantly grabbing their shoulders, shaking them and yelling “DO YOU KNOW WHAT YOU WANT TO DO WITH THE REST OF YOUR LIFE? WHY HAVEN’T YOU FIGURED IT OUT YET?” Shaken and often intimidated, they begin the college search. Everyone seems to have their own opinion on where they should go, why they should go there, and what they should major in often based on surface-level knowledge of the person’s interests and academic achievements. Meanwhile, the student is trying to process all of that external pressure while simultaneously looking inward and asking “What do I want? Do I know what I want? Is what I want more important than what my parents want?”. Then they open the Common Application and stare down the gargantuan list of schools they can apply to, and if they are not lucky enough to have an exact school in mind (which is usually a majority of high schoolers) they begin trying to figure out what they want out of their university experience. Do they want big or small? City, suburb, or rural? Secular or religious? Public or private? Their answers to these questions are often affected by their (or their parents’) financial situation, but after those considerations, much of the decision is left up to them. However, regardless of what combination of features that the student picks, for most parents there is another metric that is even more important than class sizes: campus safety. With so many horror stories of binge drinking, hazing, and sexual assaults on campuses circulating seemingly non-stop in the news, parents are often the most concerned about crime rates on campus and in the surrounding area.
As a suburban girl born and raised, this writer’s top priority in college choice was that the campus had to be a part of a mid-to-large size city. After spending three years at the University of Pittsburgh, I personally have found that the Oakland campus feels very safe. I have walked on and around campus very late at night, often alone (sorry mom!), and cannot remember a time when I felt unsafe. When I learned that I could have access to the Pittsburgh Police arrest data going back several years, I wanted to determine whether the numbers available backed up my feelings and experiences. The data provided in the set begins in August of 2016 and continues through to January 1st, 2019. For the purposes of this article, I extracted the data that covered the fall and spring semesters of those years, from the opening of the campus and residence halls all the way to its closing 1. After removing the data relevant to Pitt’s semesters, I had 17,502 arrest records over five semesters2—Fall 2016, Spring and Fall 2017, and Spring and Fall 2018. The dataset supplies the following information about each arrest:
- PK: unique identifier for each arrest incident
- CCR: incident number
- Age, gender, and race of the suspect
- ARREST_TIME: date and time of arrest
- Arrest location
- OFFENSES: the arrest code and explanation
- Incident Location, Neighborhood, Zone, and Tract
- Exact Longitude and Latitude Coordinates
With my relevant data, I arranged it all in alphabetical order by neighborhood so that I could pinpoint arrests made in Central, North, South, and West Oakland which came out to 442 arrests over five semesters.
When looking at this number proportionally, arrests in Oakland made of 2.525% of the total arrests in Pittsburgh during these five semesters from 2016-2018. To better understand this number, I compared it with what percent Oakland makes up of Pittsburgh’s square mileage and population. Oakland’s total area is 1.452 sq miles, which is 2.490% of the city of Pittsburgh 3and its population is 8,663 which is 2.833% of Pittsburgh’s total population4. Looking at these numbers, Oakland’s arrest rate is actually surprisingly proportional to its percentage of Pittsburgh.
Additionally, when comparing Oakland to the rest of Pittsburgh, I extracted from my data the nine neighborhoods with the highest number of arrest, making a list of ten neighborhoods to compare. Below is a bar chart comparing these arrest numbers:
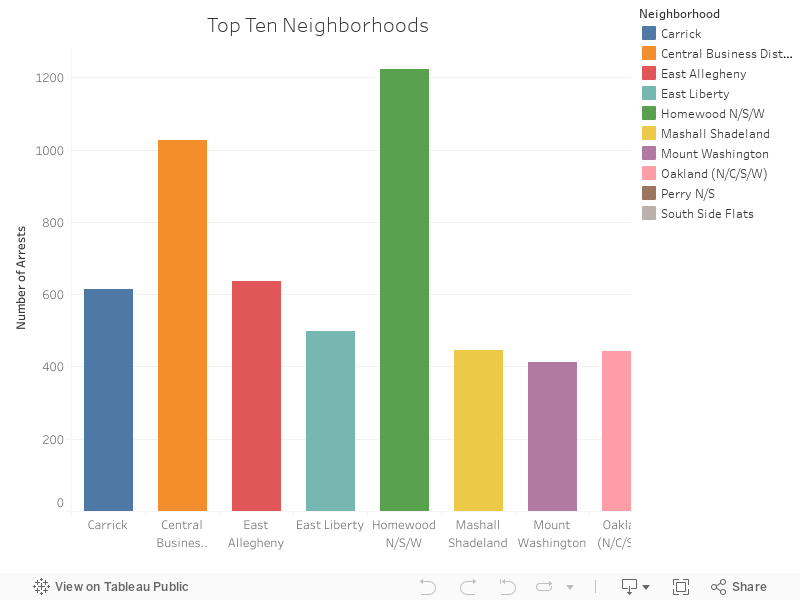
As you can see, Oakland does fall into this Top Ten list, coming in ninth. Listed in alphabetical order, this graph shows the number of arrests in 10 neighborhoods during the five semesters from Fall 2016 – Fall 2018: Carrick, Central Business District (AKA “Downtown Pittsburgh”), East Allegheny, East Liberty, Homewood N/S/W, Marshall-Shadeland, Mount Washington, Oakland N/C/S/W, Perry N/S, and South Side Flats. While this gives a good sense of where Oakland fits into the list of neighborhoods and their arrests, we can contextualize these numbers even further to see how their percentage of total arrests compares to the neighborhood’s percentage of Pittsburgh’s total area and population. This is represented in the heat map below:
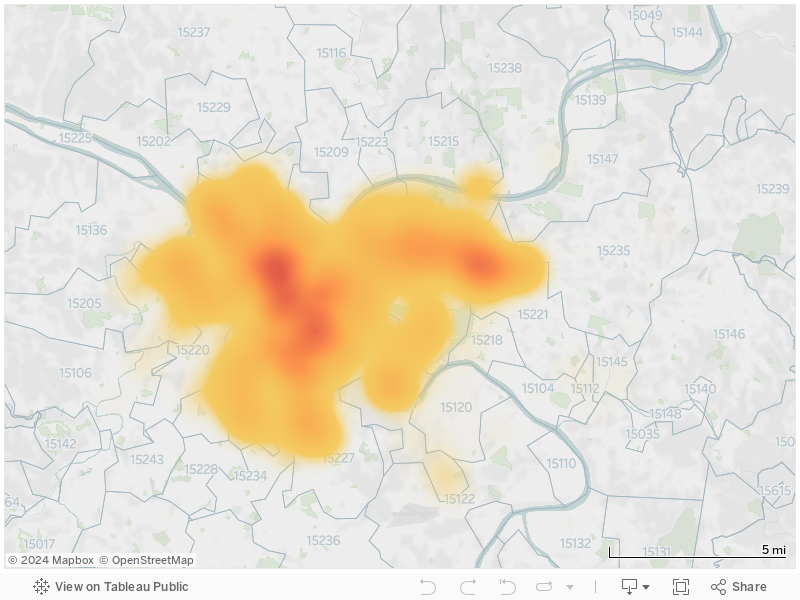
Here we can better see where the arrests are the most concentrated and compare to the size of the neighborhood. As expected, East Allegheny, South Side Flats, and Homewood have the highest concentration of arrests and Oakland appears on the lighter end of the yellow spectrum, meaning that the arrest concentration is lower than much of the rest of the map.
So, while there are risks to sending your child out to live on their own in any situation, city schools often elicit a special kind of fear in parents. Using the data on Pittsburgh Police Arrests provided by the Western Pennsylvania Regional Data Center, I have determined that arrests in Oakland, the home of the University of Pittsburgh—one of Pennsylvania’s top public universities—is entirely and surprisingly consistent with its percentage of the area and population of Pittsburgh. Also, when compared to the arrest rates of other high arrest volume neighborhoods, Oakland comes out looking pretty average. So, to parents that are considering sending their children to one of the best value public schools in the nation: while you might not know exactly where your child is at all times anymore, you can rest easy knowing that the numbers support the anecdotal evidence of a majority of Pitt students—Oakland is a safe place to live.
End Notes
- Mid-semester breaks are included in my data sets as not all students return home during those breaks.
- 670 of the relevant arrests were not adequately identified via incident neighborhood and GPS coordinates and as a result, was purged from the sample because they did not have the data that the visualizations required. 78 of these arrests were in Incident Zone 4 which is where Oakland is contained, however other neighborhoods do reside in Zone 4 so that was not enough to qualify them. This brings the total number of relevant arrests down to 17,502 as listed in the article.
- 58.35 sq mi
- 305,704